NPM module of the week: webpack-bundle-analyzer

As software folks, we live and die by the performance, or perceived performance, of the stuff we write and publish. One of the many facets of performance is file size. And with the continued onset of new and exciting NPM modules and third party code bits for us to use it becomes increasingly more important to keep a close on the size footprint these code bits have to our application.
This week I would like to highlight an open source project that helped me out recently, and that is:
webpack-bundle-analyzer
Here are a few reasons I find Webpack Bundle Analyzer worth checking out.
Easy to setup
It is refreshing to see the commonality in the tools we use. In particular, npm install with --save-dev or --save. Package managers make installing external code dependencies very simple.
After installation, Webpack Bundle Analyzer affords us a plugin to add to our webpack.config. While following the documentation, I found it very simple to install and add in the plugin. With the plugin installed I started the Webpack development server as normal, but I now had a new URL to visit that provided the full bundle report.

Popular project
Something that is important to me when considering using an open source project is how many other people are using it. The adoption of a project tends to reflect how active the project is. Though the number of users utilizing a project is not entirely accurate, if something were to go wrong there is a larger audience around to help do something about it.
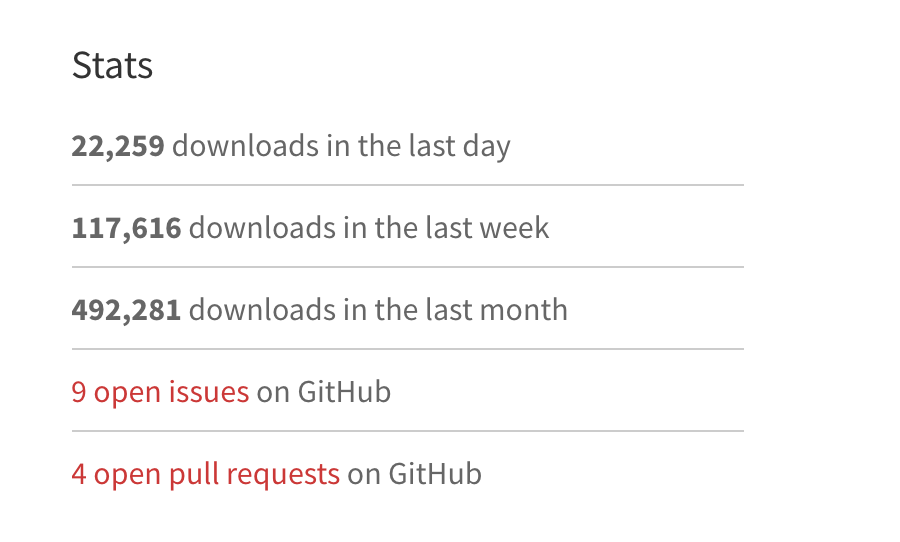
Here are some of the usage stats on Webpack Bundle Analyzer from NPM as of the writing of this post:
-
21k downloads per day.
-
113,538 in the last week.
-
Half a million downloads within the last month.

Multiple options for running the bundle report
In my example, I had used Webpack Bundle Analyzer as a plugin for my project. However, there is also an option to run this as a command line utility. That is quite handy for those of us that would like to execute the report as part of a job other than kicking off our development environment.
Simple interface 7 out of 10 in Usability
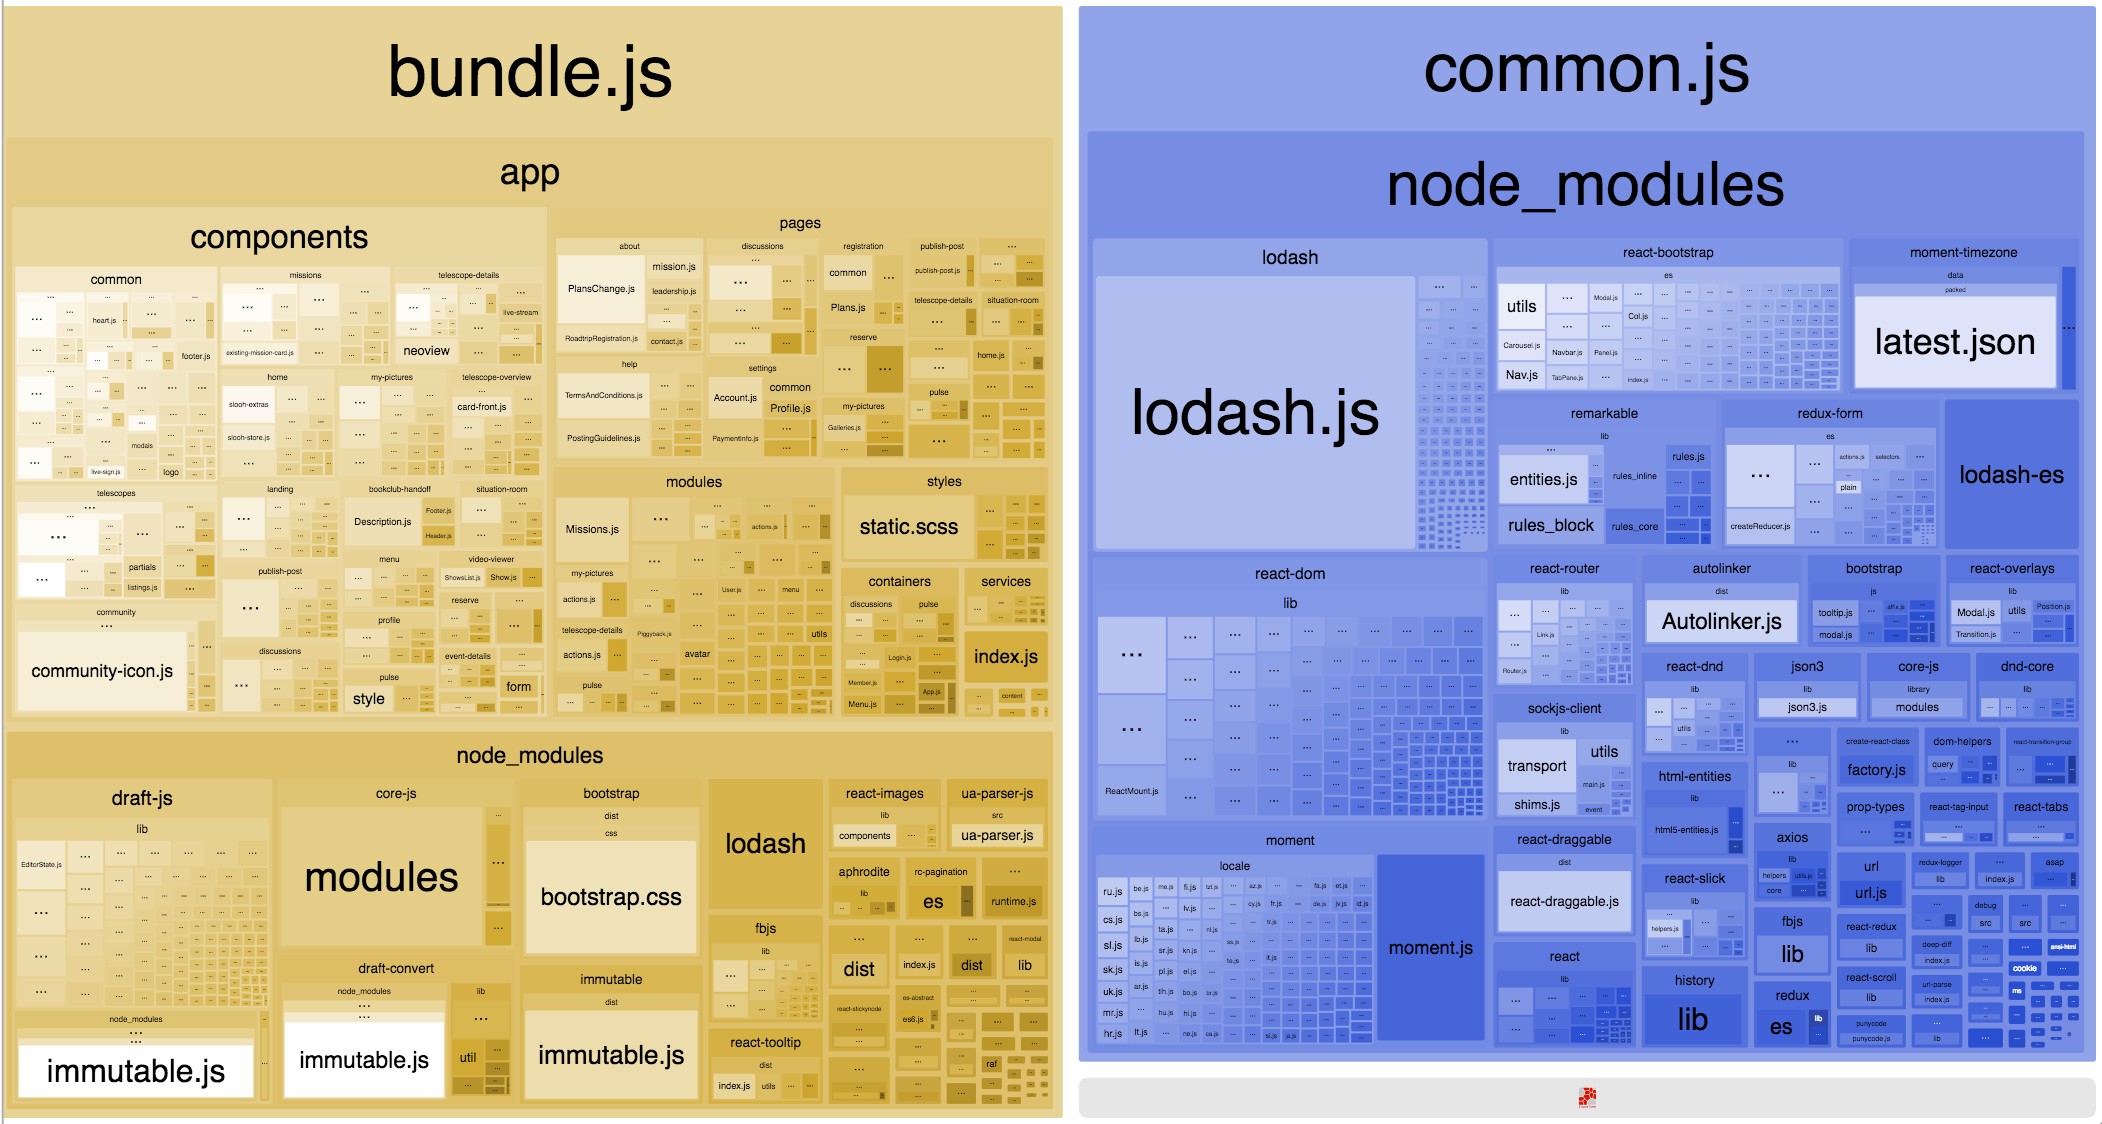
It took me about two minutes to understand what was going on with the report. I enjoy how interactive it is and the surface level detail. I use Chrome on my Macbook Pro, and I had a few issues where I needed to hard refresh the page to zoom back out. The zooming in and out of the report cells broke on me several times, more so because I believe Mac's native zoom was kicking in on top of the interactive zooming that was guiding me around the interface. This problem led me to a few stuck experiences.
Other than that I have no right to complain, it is a free tool, and it helps me better understand where I can trim the fat in my application bundle.

From the screenshot, you can gather there is a lot of useful information here that lets me know exactly where I may begin to make the biggest impact.
Try it for yourself
Head on over to the GitHub project or NPM. The documentation does a fine job in explaining the rest.
Thank you again to the open source community for continuing to bring innovation.
Connect
If you liked this post, please share it, and connect with me on LinkedIn. Feel free to use the comments below to ask questions or share your experience.
